Fort Mill Area Real Estate News & Market Trends

You’ll find our blog to be a wealth of information, covering everything from local market statistics and home values to community happenings. That’s because we care about the community and want to help you find your place in it. Please reach out if you have any questions at all. We’d love to talk with you!

Feb. 21, 2023

The Linda Hall Team, C21 First Choice Takes Home The Best of Fort Mill for the 4th consecutive year!


We are so excited to share that we have been recognized for the 4th consecutive year as “The Best of Fort Mill.” Typically, our attention is solely on our client’s feedback, but this award also means a lot to us. Here’s why:


1.       Very few companies have won the Best of Fort Mill Award for four consecutive years, so this distinction has qualified The Linda Hall Team of Century 21 First Choice for the 2023 Fort Mill Business Hall of Fame.


2.       The organization only chooses the best LOCAL businesses, which means we are competing against other local real estate teams. Real estate is a location business, which requires you to know the local real estate market and be intimately familiar with the locality. That means knowing the communities/neighborhoods.


3.       The focus is on businesses that have demonstrated an ability to use various marketing methods to grow their business despite challenging economic times. The companies they choose exemplify the best of small businesses in that they lead through customer service and community involvement. Those two areas are the foundation of our team. We give back to our community in so many ways, such as –


A.      Collecting for The Humane Society of York County, which is one of our favorite local charities.

B.      Collecting for the Fort Mill Care Center.

C.      Supporting new local businesses by promoting them on our social media platforms and in our newsletter that we send every other week.

D.      Co-hosting local events to help promote community connection.


4.       Our client satisfaction is evident through the reviews we’ve received, with 99 percent of the team’s contracts successfully closed. We also continue our relationship with our clients beyond the contracts, and one way we do that is through our annual pie event. We host this every Thanksgiving season as it’s our way of giving back to our clients and expressing gratitude for their business and our continued friendship.


So, in the end, this award is important to us because it solidifies every aspect of our mission relating to our team’s objectives. It’s based on customer service and community.  

Feb. 14, 2023

Residential Growth In York County

Recently, the Herald published an article about the emerging residential growth in York county while specifically focusing on the Fort Mill, Rock Hill, and Indian Land areas. Some of these communities have past projects that have yet to be completed and some have approved new subdivision projects. Of course, The Linda Hall Team of Century 21 First Choice is going to keep you up to date on all of this news because this will affect people looking to move and purchase homes in these communities. The article mentions that many of these projects have been delayed, but have not been canceled. Some areas will continue to see new subdivisions emerging while other areas will not. Let's take a look at what is developing.

Fort Mill

Fort Mill has seen its share of population growth over the recent years and because of that the roads, schools, and infrastructure are a primary concern when approving new plans. Some of the plans have already been approved but have yet to be constructed.

Crossroads is such an unfinished project. Their plans were finally approved in 2021 and after having been denied previously. The committee told the Mayor that there simply wasn't the infrastructure for further growth and the Mayor said she had turned down many other projects that never made it to the public's attention.

Crossroads is a senior living community with age-restricted housing. Initially, they wanted to add 460 residences and new commercial development along Fort Mill Parkway and Williams Road area. They've had to reduce their plan to 318 homes.

According to the Herald's interview with the mayor, there are 7,000 new residences that have already been approved for construction but that number could be reduced in the future and all of the construction won't happen at once.

Such a project is the Lennar project which started out with a request of 3,400 residences and ended up with 2,000 homes. Let's see if they reduce that number.

You know what! Fort Mill is a great place to live and that's why it is attracting so many people who want to call it home just like us.

York County

The Herald reported that York County saw a huge increase in 2020 for new home plans. There were 9 projects with 895 lots which was almost 4 times what it was in 2019.

In 2021 there were 15 projects and 449 residences were approved which dropped to 241 residences in 2022. And as they mentioned, as of the new year, only one of these projects has been under construction and that's a 50-lot subdivision.

Rock Hill

Rock Hill is definitely growing and this area is allowing the growth. In 2020 there were 899 units approved and in 2021 there were 1,270 units approved. Just last year there 1,627 units were approved. That's a steady increase.

The city planner, Alex Boyce, told the Herald that not all projects that are approved see completion. Some approved actually expire. So it is unknown how many projects will actually proceed.

Indian Land

Lancaster County has an interesting trend where there were more apartment units than homes approved from 2020 on. In 2022, there were TWICE as many apartments as homes.

From the Herald "Only 56% of homes and 48% of apartments on the approved list in the panhandle have been built. At year’s end there were 8,211 approved residences that hadn’t yet started construction. Of them, there are almost 5,500 homes and more than 2,700 apartments."

Tega Cay

Tega Cay is an interesting area where there were NO new developments in 2020 and 2021. The City planner, Susan Britt, told the Herald that "Permits issued in those years were for the continued development of existing subdivisions."

Source -

https://www.heraldonline.com/article271097277.html#storylink=cpy

The Linda Hall Team of Century 21 First Choice strongly recommends you read the original article for all the details of the coming new developments in the area. This was a brief outline of the areas that are in our market. If you have an interest in any of these communities please feel free to reach out to us as we'd love to help answer any of your questions or concerns. 

Posted in Community
Feb. 7, 2023

Sanders Landing Is The Place To Live

Sanders Landing is a relatively new community located off Lawrence Road in Clover, South Carolina. It's within the boundaries of the top-ranked Clover School District. The lots are between 1 to 2 acres which gives homeowners plenty of space to enjoy their outdoor hobbies and the original plan called for a subdivision with a plan of 68 homes.  

If you are seeking spacious homes with quality new construction features, then Sanders Landing may be an option for you. We include this video below which was filmed about 1 year ago. 


If you're interested in currently available homes, then please use our website. It's updated by the official REALTOR's database every 15 minutes. 

CLICK HERE TO SEARCH AVAILABLE SANDERS LANDING HOMES

Posted in Community
Feb. 1, 2023

January 2023 Real Estate Market Update for York County SC

The above video shows us a quick overview of the market, but let's dive deeper with this comprehensive look at the JANUARY 2023 real estate market in York County, South Carolina.

New Listings

We start by looking at the NEW LISTINGS that came on the market in JANUARY, and we begin with 2021, where we see there were 490 NEW LISTINGS that came on the market. In JANUARY of 2022, we found we decreased by -12.4 percent with 429 NEW LISTINGS. This year in JANUARY, we decreased by -13.5 percent with 371 NEW LISTINGS. 

Homes for Sale

We, again, start by looking at JANUARY 2021, where we see there were 681 HOMES FOR SALE. In JANUARY of 2022, we find a decrease of -9.7 percent with 615 HOMES FOR SALE. This year in JANUARY, we increased by +14.0 percent with 701 HOMES FOR SALE. 

Pending Sales

Let's view JANUARY of 2020, where we see there were 494 PENDING SALES. In 2022, we decreased by -9.9 percent with 445 PENDING SALES. This year we decreased by -9.7 percent with 402 PENDING SALES. 

Average Days on Market

Let's view JANUARY of 2021, where we see there were 33 AVERAGE DAYS ON MARKET. In 2022, we decreased from the previous year by -12.1 percent, with 29 Average Days on the Market. This year we increased by +89.7 percent with 55 Average Days on the Market. 

Months Supply of Homes for Sale:

In JANUARY of 2021, the MONTHS SUPPLY OF HOMES FOR SALE was 1.3 months. In 2022 we decreased by -7.7 percent from the previous year with a 1.2 MONTHS SUPPLY OF HOMES FOR SALE. This year we increased from the previous year by +41.7 percent with a 1.7 MONTHS SUPPLY OF HOMES FOR SALE. This statistic is the ratio of new houses for sale to new houses sold. In other words, it would take 1.7 months for the current inventory of homes on the market to sell given the current sales pace.

Average Showings to Pending 

In JANUARY of 2021, the Average Showings to Pending were 22. In 2022 we decreased by -18.2 percent from the previous year, with 18 showings to pending. This year we increased from the previous year by +5.6 percent to 19 showings to pending. 

So there is your comprehensive LOCAL look at the real estate market. If you are considering selling your home this year, pricing your home correctly will make a world of difference and we'd like to help you with that. Contact The Linda Hall Team. Let's reach your real estate goals in 2023!

Posted in Market Updates
Jan. 23, 2023

December 2022 Local Market Update for 5 Communities

Last month we reviewed 5 local community real estate markets. It was a popular blog, so we've decided to make it a regular monthly feature. This time we're going to do a year-over-year comparison for the month of December. So here they are in alphabetical order. 


CLOVER

New Listings: There were 21 new listings that came on the market in December 2022, which was a -52.3 percent decrease from the previous year when there were 44 new listings. 

Inventory: There were just 67 homes for sale in the Clover market, which was a slight decrease of -5.6 percent from 2021 when there were 71 homes on the market. 

The Months Supply of Homes for Sale: This remained the same from 2021 to 2022 with 1.5 months supply of homes.  

The Sales Price: There was a slight increase in the median sales price from 2021 to 2022, with a +7.6 percent increase. The price in 2021 was $331.620; in 2022, it was $356,745

The Shows Per Listing: There was a decrease of shows per listing of -25.4 percent, with 4.7 shows in 2022 and 6.3 in 2021. 

Very interesting market in Clover. Our inventory of homes was less in 2022, although the months supply of homes remained the same. The sales price increased a bit in 2022 from 2021. Clover is still seeing movement, and perhaps with the inflation easing a bit, and sellers will be more apt to choose to list their homes. 
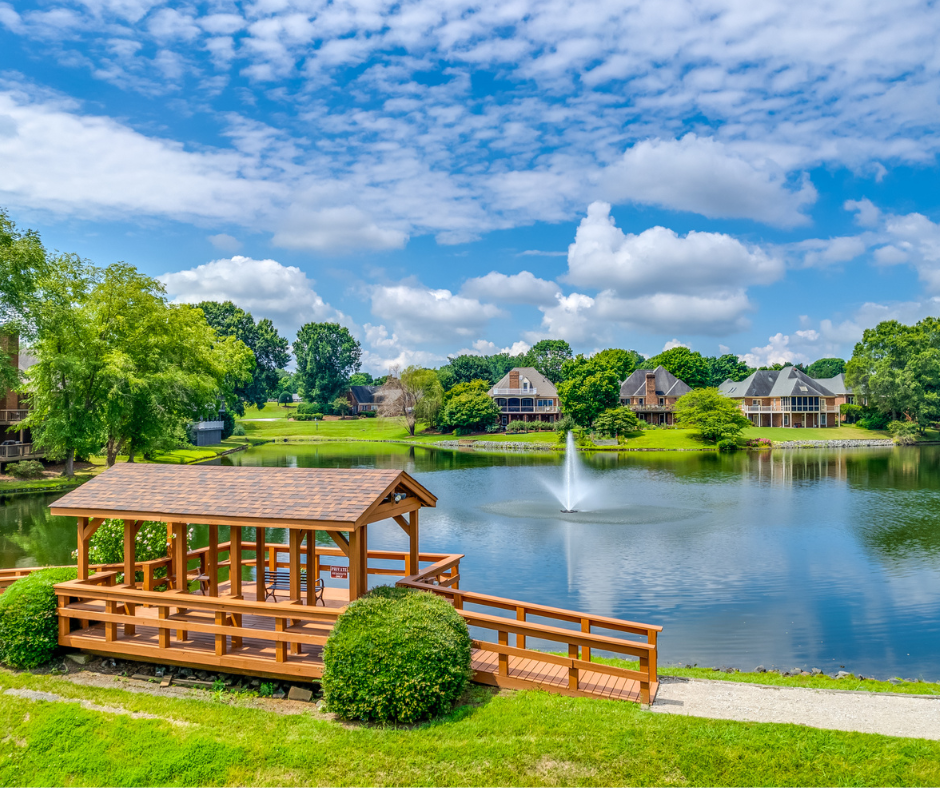
FORT MILL

New Listings: 48 new listings came on the market in December 2022, which was a -28.4 percent decrease from the previous year when there were 67 new listings. 

Inventory: There were 102 homes for sale in the Fort Mill market, which was an increase of +25.9 percent from 2021 when there were 81 homes on the market. 

The Months Supply of Homes for Sale: We actually saw a +50.0 percent increase from 2021 to 2022. There was a 1.2 months supply of homes for sale in 2022, and in 2021 there was only a 0.8 months supply of homes for sale. 

The Sales Price: There was a +28.6 percent increase in the median sales price from 2021 to 2022. The price in 2021 was $500,000, and in 2022 it was $643,000

The Shows Per Listing: There was a decrease of shows per listing of -53.2 percent, with 6.5 shows in 2022 and 13.9 in 2021. 

As you can see, Fort Mill is quite different from Clover. The inventory of homes was more in 2022 and the months supply of homes increased in 2022 as well. The sales price increased quite a bit, and the shows per listing were down by over half!

LAKE WYLIE

New Listings: 6 new listings came on the market in December 2022, which was a -64.7 percent decrease from the previous year when there were 17 new listings. 

Inventory: There were just 28 homes for sale in the Lake Wylie market, which was a decrease of -26.3 percent from 2021 when there were 38 homes on the market. 

The Months Supply of Homes for Sale: We saw a +41.7 percent increase from 2021 to 2022. There was a 1.7 months supply of homes for sale in 2022, and in 2021 there was a 1.2 months supply of homes for sale. 

The Sales Price: There was a -19.3 percent decrease in the median sales price from 2021 to 2022. The price in 2021 was $610,000, and in 2022 it was $492,500

The Shows Per Listing: There was a decrease in shows per listing of -20.0 percent, with 5.6 shows in 2022 and 7.0 in 2021. 

Lake Wylie has seen a decrease in new inventory as well as existing inventory. The sales price also decreased in 2022 and the shows per listing did as well.  
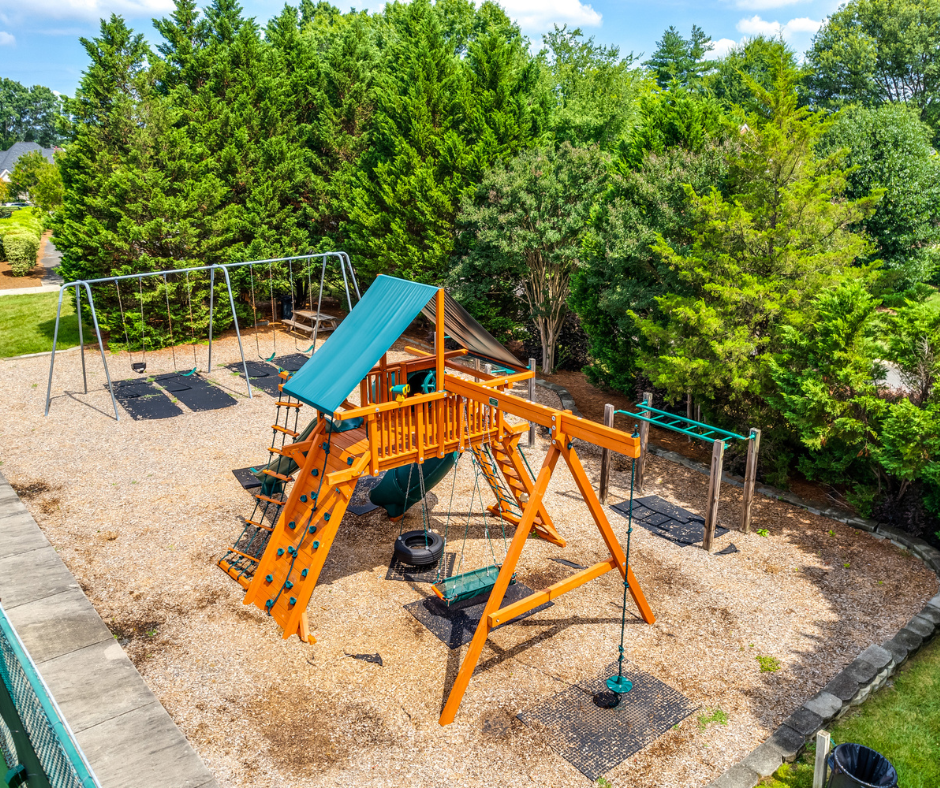
ROCK HILL

New Listings: 63 new listings came on the market in December 2022, which was a -37.6 percent decrease from the previous year when there were 101 new listings. 

Inventory: There were 180 homes for sale in the Rock Hill market, which was an increase of +55.2 percent from 2021 when there were 116 single-family homes on the market. 

The Months Supply of Homes for Sale: We saw a +87.5 percent increase from 2021 to 2022. There was a 1.5 months supply of homes for sale in 2022, and in 2021 there was a 0.8 months supply of homes for sale. 

The Sales Price: There was a +9.3 percent increase in the median sales price from 2021 to 2022. The price in 2021 was $295,000, and in 2022 it was $322,450

The Shows Per Listing: There was a decrease in shows per listing of -48.7 percent, with 6.0 shows in 2022 and 11.7 in 2021. 

Rock Hill had a decrease in new inventory and an increase in existing inventory. The sales price increased, and the shows per listing decreased by almost half from the previous year. 
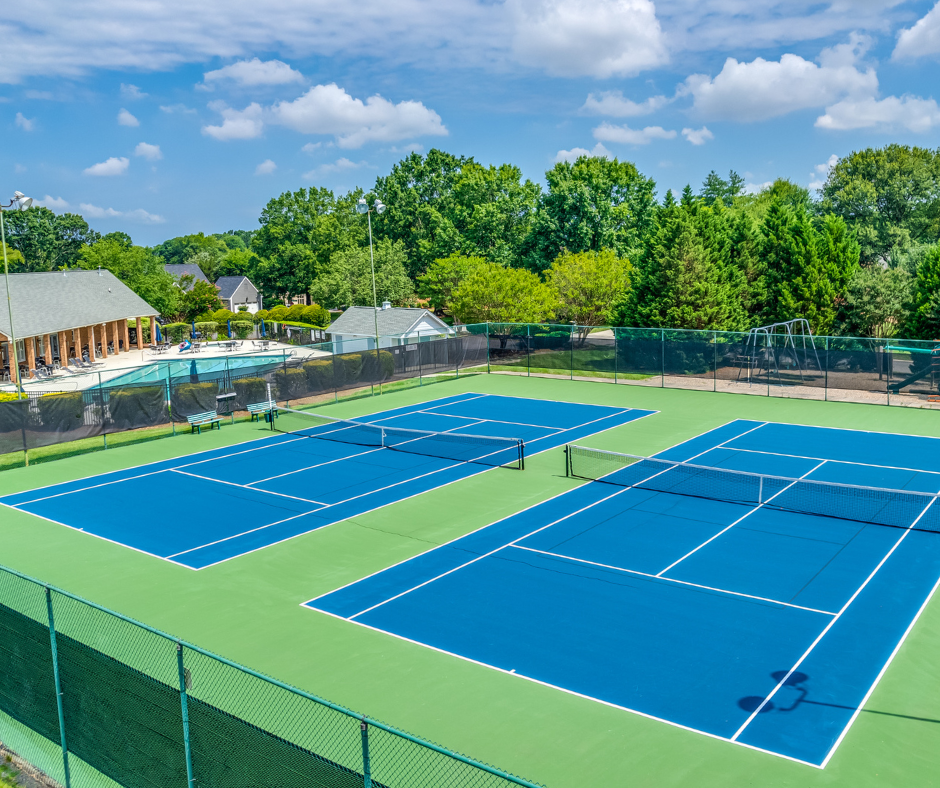
TEGA CAY

New Listings: There were only 10 new listings that came on the market in December 2022, which was a -44.4 percent decrease from the previous year when there were 18 new listings. 

Inventory: There were 22 single-family homes for sale in the Tega Cay market, which was an increase of +46.7 percent from 2021 when there were 15 single-family homes on the market. 

The Months Supply of Homes for Sale: We saw a +66.7 percent increase from 2021 to 2022. There was a 1.0 months supply of homes for sale in 2022, and in 2021 there was a 0.6 months supply of homes for sale. 

The Sales Price: There was a -8.1 percent decrease in the median sales price from 2021 to 2022. The price in 2021 was $537,500, and in 2022 it was $494,000.

The Shows Per Listing: There was a decrease in shows per listing of -66.0 percent, with 6.6 shows in 2022 and 19.4 in 2021. 

Tega Cay had a decrease in new inventory and an increase in existing inventory. The sales price decreased, and the shows per listing decreased by over half from the previous year. 
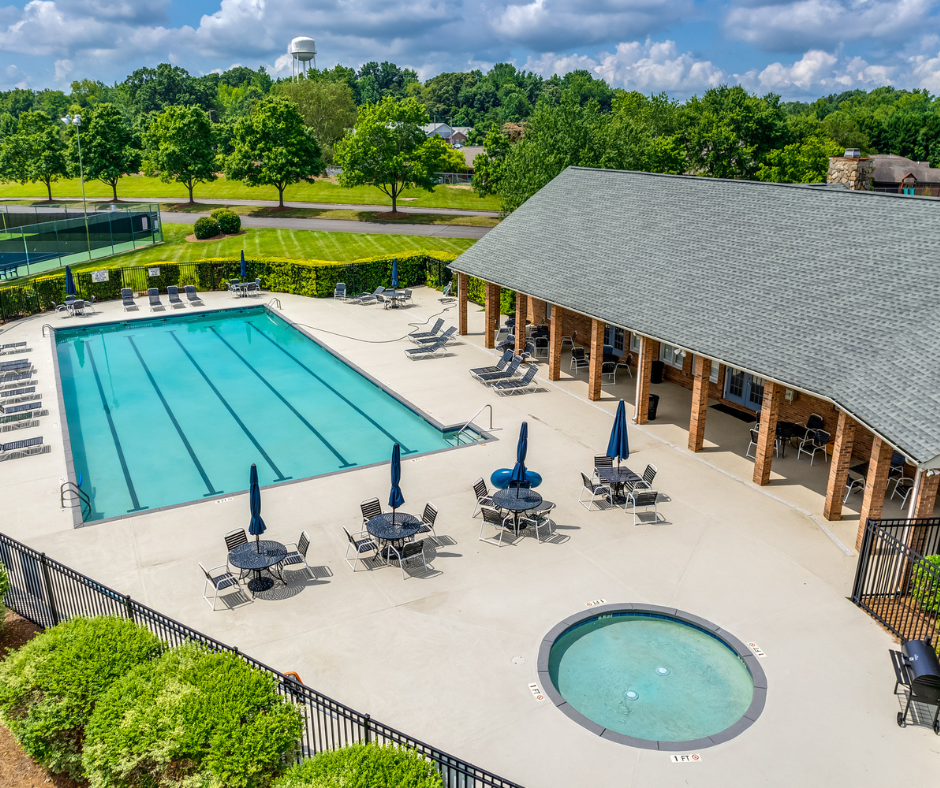
CONCLUSION

As you can see from our 5 local real estate markets, things are very different when you look at a micro-view of each community. You can further zero in on neighborhoods to get an even clearer picture to pertain to your situation. Give us a call if you want a market analysis or to find out what equity you have in your current home. 

Posted in Market Updates
Jan. 17, 2023

UPDATED 2023: Local York County Options For Those Planning ahead for Valentine’s Day

Some people may be making plans for their Valentine’s Day, and this inspired The Linda Hall Team to update and share some of their local favorite York County businesses that you might want to use for this special day. 

Take Home or Quick Stop Goodies 

Tega Graze offers a unique start to your Valentine's Date Night. Plan on beginning the celebration with a perfectly themed box filled with seasonal meats, cheeses, breads/crackers, spreads, fruit/veggies, and topped off with decadent chocolate treats and sweets. The storefront offers 3 different "grab and go" options or pre-order with 24-48 hours' notice  and choose from a wide selection – Tega Graze

Saltwater Markets is the perfect option for those wishing to stay in this Valentine’s day with their sweety! They make cooking fun with fresh seafood products AND premium meats as well! Did someone say surf and turf? Yes, please! They have 3 locations - CLOVER, FORT MILL, AND GASTONIA - Saltwater Markets

The Social Cork Wine Bar is located next door to Saltwater. So stop in for a special glass of wine and grab an appetizer before heading to Saltwater to get your surf and turf to take home. The Social Cork Wine Bar

Fort Mill Flowers is the perfect place to order your Valentine a beautiful bouquet of fresh flowers. They are located conveniently at 2000 Highway 160 W, Fort Mill – Fort Mill Flowers

Crossings on Main is another favorite local business that Linda Hall LOVES. This gift shop has something for everyone! It’s a great option for those who are looking for that special surprise! Visit their website – Crossings on Main

Chocolat Boutique has a wide array of sweet treats for your Valentine. You can pre-order your Valentine’s gifts either in-store, online or by phone. Visit their special Valentine section on their website – Chocolate Boutique

Cupcrazed Cakery is another sweet stop for those looking for a special Valentine’s Day dessert. They have a menu of cupcakes, cakes, macarons, cookies, cake pops, and all kinds of delicious baked goods – Cupcrazed Cakery


Restaurants for Valentine's Day

Clover

Lily's Bistro located at 4547 Charlotte Hwy, Clover. Phone: 803-701-7788.


Fort Mill - Top 3 Choices

Epic Chophouse located at 1365 Broadcloth Street, #101, Fort Mill. Phone: 803-548-EPIC.

Napa at Kingsley located at 1310 Broadcloth Street, #101, Fort Mill. Phone: 803-548-6335.

Fish Market located at 990 Market Street, Fort Mill. Phone: 803-547-4024.


Lake Wyle 

Papa Doc's located at 3990 Charlotte Hwy, Lake Wylie. Phone: 803-831-0043.


Rock Hill

The Pump House located at 575 Herrons Ferry Road, Rock Hill. Phone: 803-329-8888.


Tega Cay

Famous Toastery if you are doing breakfast, brunch, or lunch. Located at 2429 Highway 160 West, Tega Cay. Phone: 803-548-1440.


We hope we mentioned one of your favorite local York County businesses or we introduced you to one that will soon become your favorite. Enjoy your Valentine’s Day!

Oh, and one more thing. If you'd like to keep up with the latest events, news, and local happenings in your community, feel free to sign up for our newsletter. It's sent out every other week and is packed full of local info!! SIGN UP HERE!


Posted in Community
Jan. 11, 2023

Get to Know This Fabulous Fort Mill Business - The Social Cork Wine Bar


Linda Hall of The Linda Hall Team likes to promote exceptional local businesses, and The Social Cork Wine Bar is both local and exceptional. Linda wants you to know about them as she believes you will feel the same way.

The Social Cork Wine Bar is next to Linda’s other favorite local small business, The Saltwater Markets. We did a blog on them before, and we’re telling you that you have the best in both worlds regarding seafood and wine. So it’s natural they are located next door to each other.

The owners of The Social Cork Wine Bar are Jay and Melony Speelman. Jay and Melony were born in New York and met in 2003 when Mel was only 23 years old. James says Mel is the gift that keeps on giving. 😊

They moved to the Carolinas back in 2008, as they were in search of a great life and an excellent education for their daughter, Julianna, who was only two years old at the time. Julianna is now 16 years old and attends Clover High. She’s on the cheerleading team, the Charlotteallstars. They are all living their best life here, and to further expand on that beautiful life, they left their corporate jobs and opened this fantastic community gathering spot, The Social Cork Wine Bar, in 2022.

In just that short period, they’ve hit the ground running to meet their mission of providing community connections. They host Happy Hours, Live Music, including Caribbean Nights, Monthly Wine Tasting, and more. We’ll list their events for February, and it is definitely a place to take your sweetie on Valentine’s Day.

They not only serve the best wine around but also outstanding food. Here are links to their menus for Happy Hour, and their general Menu.

Oh, and another thing that you might be interested in is you can host private events at The Social Cork Wine Bar. Even though they are usually closed for brunch and lunch, private parties can host events at those times. They have a room that will accommodate small to mid-size groups. So, if you have a bridal party, baby shower or holiday event, or even a private wine-tasting party, engagement, or birthday party, you have a space for it. Gather more information by visiting here, The Corvino Room.

January Events

Monday and Tuesday Nights – Happy Hour from 4 pm to 7 pm

Wednesday Nights – Live music from 7 pm to 9:30 pm

Thursday, January 12th Monthly Wine Tasting - Limited seating. Call to reserve your spot 803-802-5916. Tickets are $50 per person, starting at 6:30 pm

Friday, January 13th Teacher and Nurse Appreciation Day – All day 20% off food from 12 pm to 11 pm

Saturday, January 14th Parking Lot Party – Oyster Roast with Saltwater Markets from 3 pm to 5 pm

Keep in Touch

Follow The Social Cork Wine Bar on Facebook and Instagram to stay up to date on all their upcoming events, and subscribe to The Linda Hall Team newsletter, as you will be notified of all the area events and news every other Thursday.

Linda Hall Newsletter

The Social Cork Wine Bar Facebook Page

The Social Cork Wine Bar Instagram Page

The Social Cork Wine Bar Website


Hours

Sunday – closed

Monday – Thursday – 4 pm to 10 pm

Friday – Saturday – 12 pm to 11 pm


Location

887 Gold Hill Road

Fort Mill, SC 29708

803-802-5916

Posted in Community
Jan. 1, 2023

December 2022 Real Estate Market Update for York County SC

The above video shows us a quick overview of the market, but let's dive deeper with this comprehensive look at the DECEMBER 2022 real estate market in York County, South Carolina.

New Listings

We start by looking at the NEW LISTINGS that came on the market in DECEMBER, and we begin with 2020, where we see there were 297 NEW LISTINGS that came on the market. In DECEMBER of 2021, we found we decreased by -2.7 percent with 289 NEW LISTINGS. This year in DECEMBER of 2022, we decreased by -37.7 percent with only 180 NEW LISTINGS. 

Homes for Sale

We, again, start by looking at DECEMBER 2020, where we see there were 372 HOMES FOR SALE. In DECEMBER of 2021, we find an increase of +3.0 percent with 383 HOMES FOR SALE. This year in DECEMBER, we increased by +25.8 percent with 482 HOMES FOR SALE. 

Pending Sales

Let's view DECEMBER of 2020, where we see there were 343 PENDING SALES. In 2021, we decreased by -13.7 percent with 296 PENDING SALES. This year we decreased by -32.1 percent with 201 PENDING SALES. 

Average Days on Market

Let's view DECEMBER of 2020, where we see there were 25 AVERAGE DAYS ON MARKET. In 2021, we decreased from the previous year by -28.0 percent, with 18 Average Days on the Market. This year we increased by +111.1 percent with 38 Average Days on the Market. 

Months Supply of Homes for Sale:

In DECEMBER of 2020, the MONTHS SUPPLY OF HOMES FOR SALE was 0.9 months. In 2021 we stayed even with the previous year with a 0.9 MONTHS SUPPLY OF HOMES FOR SALE still. This year we increased from the previous year by +66.7 percent with a 1.5 MONTHS SUPPLY OF HOMES FOR SALE. 

Average Showings to Pending 

In DECEMBER of 2020, the Average Showings to Pending were 20. In 2021 we decreased by -15.0 percent from the previous year, with 17 showings to pending. This year we increased from the previous year by +11.8 percent to 19 showings to pending. 

So there is your comprehensive LOCAL look at the real estate market. If you are considering selling your home this year, although things are changing, there are still opportunities, and that goes for our buyers too. Let us help you get a competitive advantage. Please reach out to the Linda Hall Team. We'd love to assist you!!

Posted in Market Updates
Dec. 21, 2022

10 Reasons You Should Own a Home in 2023


  1. Financial Security: Owning a home is a great way to build financial security, as you can use the equity in your home to secure loans or lines of credit. 
  2. Tax Benefits: Homeowners can take advantage of certain tax benefits, such as deductions for mortgage interest or property taxes.
  3. Build Wealth: Owning a home can be an effective way to build wealth over time because homeowners often benefit from increasing home values.
  4. Stability: Homeownership provides a sense of stability and security, as you can remain in your home for as long as you want.
  5. Customization: When you own a home, you can customize it to fit your lifestyle and make it your own.
  6. Pride of Ownership: Owning a home can bring a sense of pride and accomplishment.
  7. Interest Rates: Interest rates are higher than we would like, although if you plan on staying in the home for a number of years, you can always refinance in the future when the rates come down. 
  8. Community: Owning a home is a great way to become more involved in your community and build relationships with your neighbors.
  9. Forced Savings: Making your mortgage payments every month is a great way to force yourself to save money.
  10. Future Options: Owning a home allows you to stay in the home or eventually sell it to use the equity for other real estate investments.

Equity. Let's look at one additional reason owning a home is a good idea and this ties into financial security, wealth, forced savings, and future options. We're talking about the equity you'll build while owning a home. If you rent, you are building someone else's equity and wealth.

Dec. 13, 2022

The Real Estate Story of 5 Local York County Communities

Today we decided to share the real estate story of 5 local York County communities. Our goal, as The Linda Hall Team of Century 21 First Choice, is to continue to be a local resource. That includes local events that are happening, business openings, news, and of course, real estate. If you want to keep up with the local community, please sign up for our newsletter. We send this out every other week on Thursday at 9 am. You can count on it. We will never spam your email box. Sign up - HERE.

Let's get started. We will be reviewing year-over-year stats for each community for the past month of November. This is for Single-Family residences. 


#1. FORT MILL

Median Sales Prices: The median sales price of homes in Fort Mill for November 2022 was $531,000. This was an increase of 19.3 percent over 2021. In November 2021, the median sales prices were $445,000, and in 2022, it was $390,000.

Median Days on Market: The median days on the market in Fort Mill for November 2022 were 4 days. This was an increase of 33.3 percent from 2021, where the median days were 3, and in 2020 the median days were 11 days!! So the homes are still moving when compared to the past 2 years. 

New Listings on Market: The new listings on the market decreased by 15.3 percent from 2021, with only 1,148 homes on the market. In November of 2021, there were 1,356 homes on the market, which was a 7.1 percent decrease from 2020. In 2020 there were 1,459 homes on the market. So the inventory of homes (competition) has decreased over the past 2 years. That's good news for those considering listing their homes. 

Median Percent of Original Price: There's good news here. The median percent of the original price in November of 2022 was 100.3 percent. That was only a very slight decrease of -0.5 percent from 2021, which was 100.8 percent. In 2021 we increased by 1.8 percent from 2020, where it was 99.0 percent. 


In conclusion, in Fort Mill, the sales price has increased from the previous year, the time on the market has increased from 3 to 4 days, and the competition has decreased. The amount sellers are getting is above the previous two years. There's still an opportunity if you are looking to make a move in 2023, Fort Mill friends.


#2. CLOVER 

Median Sales Prices: The median sales price of homes in Clover for November 2022 was $372,665. This was an increase of 18.3 percent over 2021. In November 2021, the median sales prices were $315,000, and in 2022, it was $274,950.

Median Days on Market: The median days on the market in Clover for November 2022 were 9 days. This was an increase of 80.0 percent from 2021, where the median days were 5, and in 2020 the median days were 15 days!! So we're ahead of where we were in 2020 but a longer time period than 2021. Patience may be required.

New Listings on Market: The new listings on the market increased by 5.2 percent from 2021, with 647 homes on the market. In November of 2021, there were 615 homes on the market, which was a 12.6 percent increase from 2020. In 2020 there were 546 homes on the market. 

Median Percent of Original Price: There's good news here. The median percent of the original price in November of 2022 was 100.0 percent. That is keeping even with what the median percent of the original price was back in November of 2021. In 2021 we increased slightly over the previous year by 1.4 percent, where it was 98.6 percent. 


So in Clover, the sales price has increased from the previous two years, the time on the market increased from the previous year but is still significantly lower than it was in 2020, and the number of homes coming on to the market has increased by 32 homes. Clover is a bit different from the Fort Mill community, but activity is still happening. 

#3. LAKE WYLIE

Median Sales Prices: The median sales price of homes in Lake Wylie for November 2022 was $567,185. This was an increase of 23.9 percent over 2021. In November 2021, the median sales prices were $457,709, and in 2022, it was $395,000.

Median Days on Market: The median days on the market in Lake Wylie for November 2022 were 10 days. This was an increase from 2021, where the median days were 3, and in 2020 the median days were 24 days!! So we're still ahead of where we were in 2020 but a longer time period than 2021.

New Listings on Market: The new listings on the market are significantly lower as they decreased by 46.5 percent from 2021, with only 229 homes on the market. In November of 2021, there were 428 homes on the market, which was a 14.2 percent decrease from 2020. In 2020 there were 499 homes on the market. 

Median Percent of Original Price: There's good news here. The median percent of the original price in November of 2022 was 100.0 percent. That is keeping even with what the median percent of the original price was back in November of 2021. In 2021 we increased ever so slightly over the previous year by 0.7 percent, which was 99.3 percent. 


So in Lake Wylie, the sales price has increased significantly from the previous two years, the time on the market increased from the previous year but is still lower than it was in 2020, and the number of homes coming onto the market has decreased by A LOT which means the competition is low. Lake Wylie isn't doing too bad.


#4. ROCK HILL

Median Sales Prices: The median sales price of homes in Rock Hill for November 2022 was $330,000. This was an increase of 17.9 percent over 2021. In November 2021, the median sales prices were $280,000, and in 2022, it was $245,000. That was a 14.3 percent year-over-year increase. 

Median Days on Market: The median days on the market in Rock Hill for November 2022 were 6 days. This was an increase from 2021, where the median days were 4, and in 2020 the median days were 12 days!! So we're still ahead of where we were in 2020 but a slightly longer time period than 2021.

New Listings on Market: The new listings on the market are lower as they decreased by 9.3 percent from 2021, with 1,766 homes on the market. In November of 2021, there were 1,948 homes on the market, which was a 9.2 percent increase from 2020. In 2020 there were 1,784 homes on the market. 

Median Percent of Original Price: The median percent of the original price in November of 2022 was 100.0 percent. That was decreased by 1.0 percent from what the median percent of the original price was back in November of 2021. In 2021 we increased over the previous year by 1.0 percent, which was 100.0 percent.


So in Rock Hill, the sales price has increased significantly from the previous two years, the time on the market increased from the previous year but is still lower than it was in 2020, and the number of homes coming onto the market has decreased by the previous two years which means the competition is low. Go Rock Hill! 


#5. TEGA CAY

Median Sales Prices: The median sales price of homes in Tega Cay for November 2022 was $520,760. This was an increase of 14.5 percent over 2021. In November 2021, the median sales prices were $455,000, and in 2022, it was $400,000. That was a 13.8 percent year-over-year increase. 

Median Days on Market: The median days on the market in Tega Cay for November 2022 were 3 days. This was keeping even with the number of median days on the market in 2021, and in 2020 the median days were 14 days!!  

New Listings on Market: The new listings on the market are lower as they decreased by 5.4 percent from 2021, with 299 homes on the market. In November of 2021, there were 316 homes on the market, which was a 13.9 percent decrease from 2020. In 2020 there were 367 homes on the market. 

Median Percent of Original Price: The median percent of the original price in November of 2022 was 100.8 percent. That was decreased by 0.2 percent from what the median percent of the original price was back in November of 2021. In 2021 we increased over the previous year with 101.0 percent of the original price by 2.3 percent, which was 98.7 percent in 2020.


So in Tega Cay, the sales price has increased significantly from the previous two years, the time on the market held even with the previous year but was quite a bit lower than it was in 2020, and the number of homes coming onto the market has decreased by the previous two years which means the competition is low. Another interesting real estate market.


CONCLUSION

So as you can see, the local communities in York County vary just among themselves. This is why going by what you read nationally can confuse you. Please reach out to us and let us answer your questions. We can even zero in on your specific neighborhood. We're here for you!

Posted in Market Updates